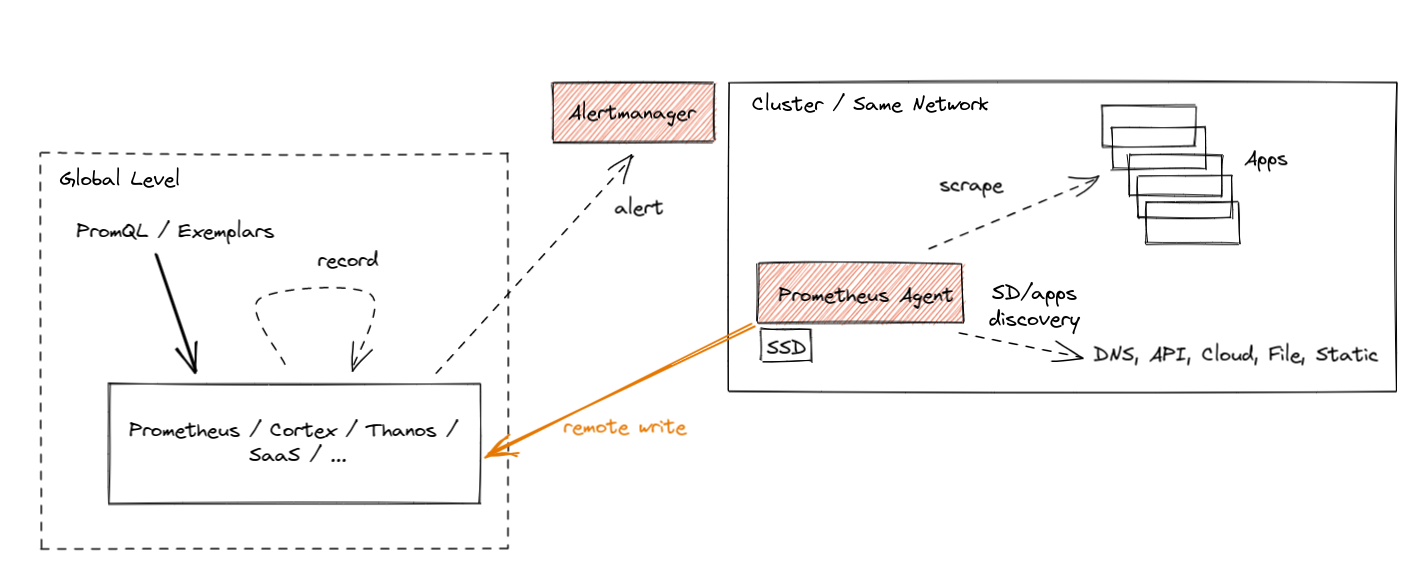
Building upon Bartłomiej Płotka's insightful blog on Prometheus and its passthrough agent mode, this post dives into implementing multi-cluster Prometheus support. Notably, the official inclusion of support in the widely-used kube-prometheus-stack came with the release in July 2023, making it easier to extend Prometheus monitoring across clusters.

Helm Configuration: Connecting Global and Edge Clusters
To deploy a Prometheus agent in your Kubernetes cluster, use the kube-prometheus-stack chart with Helm installed and configured on your cluster.
Global Cluster Configuration
Update and apply global cluster values to enable remote metrics reception:
prometheus:
  prometheusSpec:
    enableRemoteWriteReceiver: true
    enableFeatures:
    - remote-write-receiver
Edge Cluster(s) Configuration
Update and apply edge cluster values to enable remote metric writing:
- Specify the global cluster's
${hostname}remote write endpoint. - Include a scrape configuration to identify pods annotated with
prometheus.io/scrape. - Assign a unique
${name}to distinguish metric results.
prometheus:
  agentMode: true
  prometheusSpec:
    remoteWrite:
      - name: ${name}
        url: http://${hostname}:9090/api/v1/write
     # Add additional remote write configurations if needed
    additionalScrapeConfigs:
      - job_name: 'kubernetes'
        kubernetes_sd_configs:
          - role: pod
        relabel_configs:
          - source_labels: [__meta_kubernetes_pod_annotation_prometheus_io_scrape]
            action: keep
            regex: true
          - target_label: cluster
            replacement: ${name}
These resulting metrics are illustrated within the global Prometheus cluster, featuring an Apache web service managing ingress traffic in a cluster labeled as "edge."

Troubleshooting
Prometheus exposes internal metrics for effective troubleshooting. For in-depth troubleshooting steps, refer to the detailed Grafana Labs blog post.
Key metrics to monitor:
-
Queue Tracking:
prometheus_remote_storage_highest_timestamp_in_secondsandprometheus_remote_storage_queue_highest_sent_timestamp_secondswill track the backlog/queue. -
Shard Considerations:
prometheus_remote_storage_shards_desiredshould be less thanprometheus_remote_storage_shards_max. If it is greater, you may want to consider updatingmax_shards- see Prometheus Parameter Tuning.